Local Plan Monitoring Report
Rushcliffe Local Plan Monitoring Report 2020/21
Contents
- Introduction
- Key Characteristics of the Borough
- Local Plan Updates
- Duty to Cooperate
- Key Monitoring Updates
- LDF Sustainability Appraisal Monitoring Indicators
- Appendix 1: Housing Land Availability
1. Introduction
1.1 This Local Plan Monitoring Report is based upon the monitoring period 1 April 2020 to 31 March 2021.
1.2 The monitoring report contains information on the implementation of the Local Development Scheme and the extent to which policies in development plan documents are being successfully implemented.
1.3 The National Planning Practice Guidance states that local planning authorities should publish annually a monitoring report that shows progress with Local Plan preparation, reports any activity relating to the duty to cooperate and shows how the implementation of policies in the Local Plan is progressing.
1.4 The Rushcliffe Local Plan part 2 was adopted in October 2019, therefore the monitoring report of 2020/21 will monitor the targets set within part 2 of the Local Plan, together with those set in Local Plan Part 1, Core Strategy.
1.5 The purpose of the Local Plan Monitoring Report is to monitor progress against the targets established in the Local Plan and to assess how effective these policies have been by monitoring appropriate data.
1.6 Regulation 34 of the Town and Country Planning (Local Planning) (England) Regulations 2012 (Part 8) sets out what information the reports must contain. The following report has been produced in accordance with these Regulations.
1.7 The Monitoring Report has been structured into four sections as follows:
- Key Characteristics of the Borough
- Local Plan Updates
- Duty to Cooperate
- Key Monitoring Indicators
2. Key Characteristics of the Borough
2.1 The population of the borough at the time of the 2011 Census was 111,129. This was a 5.25 per cent increase from 2001. It is estimated that the population at 2020 is 121,400. The represents approximately a 9 per cent population increase over the monitoring period. The East Midlands region’s population increased by 7% over the same period with the national population increasing by 6%.
2.2 The balance between male and female residents is 49 per cent male and 51 per cent female.
2.3 The 2011 census results show that the Borough has an ageing population, with residents over 60 representing just over 25 per cent of the population (compared with 22% nationally). There are more than 5,800 residents over the age of 80, representing over 5 per cent of the population, the same as the national average.
2.4 The percentage of the population aged over 65 increased by 19 per cent between 2001 and 2011.
Ethnicity
2.5 Over 90% of the Rushcliffe population gave their ethnic group as ‘White’ in the 2011 Census.
2.6 The largest non-white ethnic group in the borough is ‘Asian/Asian British’ at 4.1 per cent, followed by ‘Mixed/Multiple Ethnic Group’ (1.8%), and ‘Black or Black British’ (0.6%).
Deprivation
2.7 According to the IMD (Indices of Multiple Deprivation) 2019 rankings, Rushcliffe Borough is one of the least deprived in England, being ranked at fourth least deprived in the country based on the overall IMD score (out of 317 local authorities).
2.8 There are pockets of relative deprivation in the borough with areas in Cotgrave and Keyworth amongst the 40% most deprived in England.
Economy
Employment
2.9 At the start of the Core Strategy monitoring period, unemployment was 5.2 per cent (March 2012). It has since decreased to 3.4 per cent for the year ending
September 2021.
2.10 Economic activity rates compare favourably to the East Midlands and national averages. As of September 2021, 82.6 per cent of residents aged 16-64 were economically active in Rushcliffe, compared to 78.3 per cent for the East Midlands and 78.5 per cent for Great Britain.
2.11 Out of the 172 wards in Nottinghamshire, only one Rushcliffe ward (Neville and Langar) feature amongst the top half for highest unemployment rates.
Labour Supply
Education
2.12 85.8% per cent of pupils in the borough gained English and Mathematics grades of 9 - 4 (A* - C equivalent) for the 2019/20 year. This was significantly higher than the Nottinghamshire average of 67.6%.
Housing
3. Local Plan Updates
3.1 The Local Development Scheme (LDS) sets out what Development Plan Documents (DPDs) the Council intends to prepare as part of the Local Plan and the programme for their operation.
3.2 The Borough Council now has a full Local Plan through the adoption of Local Plan Part 1, Rushcliffe Core Strategy and Local Plan Part 2 Land and Planning Policies. The early stages of reviewing the Core Strategy has commenced through the preparation of the Greater Nottingham Strategic Plan together with Broxtowe Borough Council, Gedling Borough Council and Nottingham City Council. An issues and Options consultation took place during the monitoring period 2020-2021.
Local Development Scheme and Milestones
3.3 The 2018 LDS was published in August 2018, part way through this monitoring period. The dates referred to in this section are based on those dates included in the 2018 LDS. The previous Local Plan Monitoring Report (2017/18) was assessed against the 2016 LDS.
3.4 Section 113 of the Localism Act (Local Development Monitoring) removed the requirement on local authorities to submit the LDS to the Secretary of State.
3.5 A number of supporting studies were also completed during the monitoring period that support the production of the Greater Nottingham Strategic Plan.
| Study | Date Completed | Author |
|---|---|---|
| Sustainability Appraisal Scoping Report | July 2020 | GNPP |
| Greater Nottingham and Ashfield Housing Needs Assessment | November 2020 | ICENI |
| Greater Nottingham and Ashfield GTAA | March 2021 | RRR |
| Greater Nottingham Green and Blue Infrastructure Strategy |
May 2020 | HMA authorities |
Supplementary Planning Documents (SPDs)
3.6 The following SPDs have been formally adopted and are still used:
- Wind Energy SPD (June 2015)
- Melton Road Edwalton Development Framework SPD (October 2015)
- Rushcliffe Residential Design Guide SPD (February 2009)
3.7 It is proposed that the following SPDs may be produced:
- Affordable Housing
- Development Requirements and Planning Contributions
Neighbourhood Plans
3.8 The Localism Act 2011 makes provision for Neighbourhood Plans to be prepared. Neighbourhood Plans are community-based documents which will be initiated by a Parish/Town Council or Neighbourhood Forum and ultimately adopted by the Council as part of the development plan. They should contain a vision and general planning policies and proposals for the future development of land in the designated area. As the local planning authority, the Borough Council has a duty to provide support to help people develop their
neighbourhood plan.
3.9 There are five key stages to neighbourhood planning:
- Defining the neighbourhood
- Preparing the plan
- Independent examination
- Community referendum
- Legal force
3.10 As of 31 March 2021, (there were ten neighbourhood plans currently either in development or adopted):
Adopted Prior to 31 March 2021
- East Leake (November 2015)
- Keyworth (June 2018)
- Radcliffe on Trent (October 2017)
- Gotham (30 January 2020)
- Upper Broughton (30 January 2020)
In preparation
- Bingham (designated August 2017)
- Hickling (pre examination consultation in progress on 31 March 2021)
- Tollerton (designated November 2016)
- Colston Basset (Referendum to be held during 2021-2022)
- Ruddington (Referendum to be held during 2021-2022)
4. Duty to Cooperate
4.1 Section 110 of the Localism Act inserts the additional section 33A (duty in co-operation to planning of sustainable development) into the Planning and Compulsory Purchase Act 2004. The responsibility it introduces applies to all local planning authorities, county councils and other bodies (as prescribed in Regulation 4 of the Town and Country (Local Planning) (England) Regulations 2012).
Duty to cooperate bodies
| Prescribed bodies | Not relevant | Relevant additional/alternative organisation(s) |
|---|---|---|
| Nottinghamshire County Council | - | - |
| Nottingham City Council | - | - |
| Gedling Borough Council | - | - |
| Erewash Borough Council | - | - |
| Ashfield District Council | - | - |
| Environment Agency | - | - |
| Environment Agency | - | - |
| Historic England | - | - |
| Natural England | - | - |
| Mayor of London | Yes | - |
| Civil Aviation Authority | - | - |
| Homes England (previously Homes and Communities Agency) |
- | - |
| Clinical Commissioning Group (prev. Primary Care Trust) |
- | Nottinghamshire and Nottingham City CCG |
| NHS England | - | North Midlands Office |
| Office of Rail Regulation | - | Network Rail |
| Transport for London | Yes | - |
| Integrated Transport Authorities | Yes | - |
| Highways Authority | - |
|
| Marine Management Organisation | Yes | - |
| Local Enterprise Partnership | - | Derbyshire and Nottinghamshire (D2N2) |
| Local Nature Partnership | Yes | Was the Lowland Derbyshire and Nottinghamshire Local Nature Partnership, although does not appear to exist at present |
4.2 The Council is satisfied that it has fulfilled the legal requirements of the Duty to Cooperate in preparing the Local Plan over the last monitoring period.
Local Planning Authorities
4.3 Extensive collaboration work with the neighbouring authorities in the Housing Market Area took place throughout development of the Local Plan Part 1: Core Strategy. This collaboration has continued through the preparation stages of the Local Plan Part 2: Land and Planning Policies.
4.4 Partnership groups involving other local planning authorities includes:
- Greater Nottingham Join Planning Advisory Board (JPAB);
- Greater Nottingham Executive Steering Group;
- D2N2 Partnership Board;
- Greater Nottingham Housing Market Area (HMA) Group;
- Nottinghamshire Policy Officers Group (NPOG)
- Nottinghamshire Development Management Liaison Group; and
- Greater Nottingham Development Monitoring Group
4.5 The input that these prescribed bodies had in shaping the Rushcliffe’s Local Plan is broadly split into three main but overlapping components – (a) evidence gathering; (b) preparation of the Local Plan content (policies and selection of allocations); and (c) the identification of development related infrastructure requirements (e.g. school places and health care facilities).
Greater Nottingham Joint Planning Advisory Board (JPAB)
4.6 The JPAB was established in April 2008 to advise the Greater Nottingham’s constituent councils on the alignment of planning work across the region and the Greater Nottingham Growth Point Programme of Development. JPAB is chaired by Broxtowe Borough and meets every two/three months and is attended by Councillors and senior officers from Ashfield District Council, Broxtowe Borough Council, Derbyshire County Council, Erewash Borough Council, Gedling Borough Council, Nottingham City Council, Nottinghamshire
County Council and Rushcliffe Borough Council.
Greater Nottingham Executive Steering Group
4.7 This is attended by senior officers for each Council in the JPAB partnership with meetings every two/three months to discuss strategic planning issues and directing the delivery of strategic development projects.
D2N2 Partnership Board
4.8 Nottinghamshire Local Authorities are represented at the D2N2 Partnership Board by Cllr Keith Girling of Nottinghamshire County Council and Cllr Simon Robinson.
Nottingham Core Housing Market Area (HMA) Officers Group
4.9 The Nottingham Core HMA officers group currently meets once a month to discuss the management and progress with the Greater Nottingham Strategic Plan, Part 2 Local Plans and the Ashfield District Local Plan. This group discusses strategic planning matters and cross boundary planning issues.
Nottinghamshire Policy Officers Group (NPOG)
4.10 The Nottinghamshire Policy Officers Group, comprising planning policy officers from all Nottinghamshire councils, meets every quarter. This group updates members on progress with Local Plans and has a useful role in co-ordinating joint working where a consistent approach is needed.
Nottinghamshire Development Management Liaison Group Meetings
4.11 Development Management officers meet quarterly to discuss development management issues.
Greater Nottingham Development Monitoring Group
4.12 Policy and/or technical officers to discuss monitoring arrangements in order for each council to ensure data is collected and reported consistently across the HMA.
5. Key Monitoring Updates
Housing Data (including 5 year land supply)
Housing Requirement and Delivery
5.1 The housing requirement for the Borough, including the methodology for calculating 5 year land supply, is set by Policy 3 of the Core Strategy. The policy requires the delivery of a minimum of 13,150 new homes between 2011 and 2028, identifying that the following phases of housing delivery will be used for monitoring purposes:
2012 – 2013
- 500
- 250 per annum
2014 – 2018
- 2,350
- 470 per annum
2019 – 2023
- 6,500
- 1,300
2024 - 2028
- 4,100
- 820 per annum
As the strategic policies are over 5 years old, 5 land supply is now calculated using the standard methodology. The standard method for Rushcliffe has been calculated from a base point of 31 March 2021. The standard method requires the Governments 2014- based household projections to be used to set a baseline requirement figure for average annual household growth over a 10 year period.
Housing Completions 2011/12-2020/21
Monitoring of new housing development takes part as the Council’s Housing Land Availability (HLA) review. This includes a full list of all extant planning approvals and tracks completions over the period April to March the following year.
- 2011/12 - 293
- 2012/13 - 209
- 2013/14 - 199
- 2014/15 - 373
- 2015/16 - 487
- 2016/17 - 528
- 2017/18 - 593
- 2018/19 - 760
- 2019/20 - 494
- 2020/21 - 650
- Total completions - 4,586
Completions (Gross) by house type 2011-2021
1 bed house
- 2011/12 - 2%
- 2012/13 - 0%
- 2013/14 - 1%
- 2014/15 - 2%
- 2015/16 - 2%
- 2016/17 - 0%
- 2017/18 - 1%
- 2018/19 - 2%
- 2019/20 - 1%
- 2020/21 - 0.3%
- Total completions - 1.1%
2 bed house
- 2011/12 - 6%
- 2012/13 - 18%
- 2013/14 - 5%
- 2014/15 - 11%
- 2015/16 - 20%
- 2016/17 - 13%
- 2017/18 - 16%
- 2018/19 - 18%
- 2019/20 - 15%
- 2020/21 - 12%
- Total completions - 13.4%
3 bed house
- 2011/12 - 32%
- 2012/13 - 20%
- 2013/14 - 22%
- 2014/15 - 20%
- 2015/16 - 27%
- 2016/17 - 18%
- 2017/18 - 31%
- 2018/19 - 30%
- 2019/20 - 22%
- 2020/21 - 27%
- Total completions - 24.9%
4+ bed house
- 2011/12 - 47%
- 2012/13 - 41%
- 2013/14 - 50%
- 2014/15 - 32%
- 2015/16 - 45%
- 2016/17 - 42%
- 2017/18 - 43%
- 2018/19 - 42%
- 2019/20 - 37%
- 2020/21 - 28%
- Total completions - 40.7%
1 bed flat
- 2011/12 - 4%
- 2012/13 - 1%
- 2013/14 - 4%
- 2014/15 - 12%
- 2015/16 - 4%
- 2016/17 - 13%
- 2017/18 - 2%
- 2018/19 - 5%
- 2019/20 - 10%
- 2020/21 - 15%
- Total completions - 7%
2 bed flat
- 2011/12 - 7%
- 2012/13 - 19%
- 2013/14 - 15%
- 2014/15 - 21%
- 2015/16 - 3%
- 2016/17 - 14%
- 2017/18 - 6%
- 2018/19 - 4%
- 2019/20 - 14%
- 2020/21 - 15%
- Total completions - 11.8%
3 bed flat
- 2011/12 - 0%
- 2012/13 - 0%
- 2013/14 - 0%
- 2014/15 - 2%
- 2015/16 - 0%
- 2016/17 - 0%
- 2017/18 - 1%
- 2018/19 - 0%
- 2019/20 - 1%
- 2020/21 - 3%
- Total completions - 0.7%
4 bed flat
- 2011/12 - 0%
- 2012/13 - 0%
- 2013/14 - 2%
- 2014/15 - 1%
- 2015/16 - 0%
- 2016/17 - 0%
- 2017/18 - 0%
- 2018/19 - 0%
- 2019/20 - 0%
- 2020/21 - 0%
- Total completions - 0.3%
Allocations
5.2 In relation to the strategic allocations, development is now complete at the Former Cotgrave Colliery,. Development is underway at North of Bingham, Former RAF Newton, Melton Road, Edwalton and South of Clifton. In addition a number of Local Plan Part 2 sites have commenced development. The following table outlines progress on all allocated sites.
| Allocation | Status | Dwellings Built to Date (April 2021) |
|---|---|---|
| Land South of Hollygate Lane, Cotgrave | Planning application under consideration | 0 |
| Land North of Rempstone Road, East Leake |
Under construction | 0 |
| Barnfield Farm Nicker Hill, Keyworth | Under construction | 4 |
| Station Road, Keyworth | Under construction | 30 |
| Land south of Debdale Lane, Keyworth | Under construction | 0 |
| Hillside Farm, Keyworth | Planning application refused | 0 |
| Land North of Nottingham Road, Radcliffe on Trent |
Planning application under consideration |
0 |
| Grooms Cottage, Radcliffe on Trent | Under Construction | 0 |
| Land off Shelford Road Radcliffe on Trent | Under Construction | 36 |
| Land north of Grantham Road Radcliffe on Trent | Planning application under consideration | 0 |
| The Paddocks, Radcliffe on Trent | No planning application received | 0 |
| Land west of Wilford Road, Ruddington | Under Construction | 0 |
| Land south of Flawforth Lane, Ruddington |
Under Construction | 0 |
| Land opposite Mere Way, Ruddington | Under Construction | 0 |
| Land at Asher Lane Ruddington | Under Construction | 0 |
| Land east of Church Street Cropwell Bishop | Under Construction | 0 |
| Land between Butt Lane and Closes Side Lane, East Bridgford |
Planning application under consideration | 0 |
| Land south of Butt Lane, East Bridgford | Outline Planning Permission Granted | 0 |
| Land east of Gypsum Way, Gotham | Planning application under consideration | 0 |
| Land north of Park Lane, Sutton Bonington |
Planning application under consideration | 0 |
| Former Bunny Brickworks | Planning application under consideration | 0 |
| Former Islamic Institute, Flintham | Planning permission expired | 0 |
5 Year Land Supply
5.3 The annual HLA review is one source of information that is used to update the Borough Council’s Strategic Housing Land Availability Assessment (SHLAA). The SHLAA is used to refresh the Borough Council’s housing trajectory (see Figure 2) and 5 year land supply assessment.
5.4 It is calculated that for the period April 2021- March 2026 Rushcliffe has a 9.2 years supply of housing.
Requirements
Method
5 year land supply assessment 2021 - 2026
- Housing target for 5 year period 2021-2026 (597/year) - 2985
- 5 Year Housing Requirement (5 year target plus 5% buffer) - 3134
- Gross supply calculation - 5871
- Lapse assumption based upon SHLAA methodology - 105
- Net supply calculation - 5766
- Total five year supply ((5766/3134)*5) - 9.2
5.5 The five year land supply assessment is updated as and when necessary, often more frequently than annually. The most up to date 5 year supply calculation is available on the Borough Council’s Local Plan monitoring webpage. This may be more up to date than the calculation included above.
Housing Trajectory (31 March 2021)
Completions on non-allocated sites and identified SHLAA capacity
Completions
- 2011/12 - 293
- 2012/13 - 290
- 2013/14 - 199
- 2014/15 - 373
- 2015/16 - 375
- 2016/17 - 338
- 2017/18 - 343
- 2018/19 - 392
- 2019/20 - 284
- 2020/21 - 355
Future Years
- 2021/22 - 180
- 2022/23 - 325
- 2023/24 - 260
- 2024/25 - 83
- 2025/26 - 88
- 2026/27 - 141
- 2027/28 - 116
Future Years (beyond plan period)
- 2028/29 - 3
- 2031/32 - 128
- 2032/33 - 14
Total 2011-2028 (plan period) - 4,354
Total 2028-2038 (beyond plan period) - 145
Land at Melton Road, Edwalton (1,500) (Policy 20)
Completions
- 2016/17 - 40
- 2017/18 - 126
- 2018/19 - 271
- 2019/20 - 144
- 2020/21 - 140
Future Years
- 2021/22 - 154
- 2022/23 - 132
- 2023/24 - 132
- 2024/25 - 132
- 2025/26 - 132
- 2026/27 - 132
- 2027/28 - 132
Future Years (beyond plan period)
- 2028/29 - 132
- 2029/30 - 83
Total 2011-2028 (plan period) - 1,667
Total 2028-2038 (beyond plan period) - 215
Land at former Cotgrave Colliery (450) (Policy 21)
Completions
- 2015/16 - 112
- 2016/17 - 150
- 2017/18 - 124
- 2018/19 - 77
Future Years
- Zero
Future Years (beyond plan period)
- Zero
Total 2011-2028 (plan period) - 463
Total 2028-2038 (beyond plan period) - 0
Land at Former RAF Newton
Phase 2 (550) (Policy 22)
Completions
- Zero
Future Years
- 2021/22 - 10
- 2022/23 - 44
- 2023/24 - 88
- 2024/25 - 88
- 2025/26 - 88
- 2026/27 - 88
- 2027/28 - 88
Future Years (beyond plan period)
- 2028/29 - 34
Total 2011-2028 (plan period) - 494
Total 2028-2038 (beyond plan period) - 34
Land north of Bingham (1,050) (policy 23)
Completions
- 2018/19 - 20
- 2019/20 - 66
- 2020/21 - 85
Future Years
- 2021/22 - 88
- 2022/23 - 132
- 2023/24 - 132
- 2024/25 - 132
- 2025/26 - 132
- 2026/27 - 132
- 2027/28 - 131
Future Years (beyond plan period)
- Zero
Total 2011-2028 (plan period) - 1,050
Total 2028-2038 (beyond plan period) - 0
Land south of Clifton (3,000) (Policy 24)
Completions
- Zero
Future Years
- 2022/23 - 22
- 2023/24 - 44
- 2024/25 - 166
- 2025/26 - 250
- 2026/27 - 250
- 2027/28 - 250
Future Years (beyond plan period)
- 2028/29 - 250
- 2029/30 - 250
- 2030/31 - 250
- 2031/32 - 250
- 2032/33 - 250
- 2033/34 - 250
- 2034/35 - 250
- 2035/36 - 250
- 2036/37 - 16
Total 2011-2028 (plan period) - 982
Total 2028-2038 (beyond plan period) - 2016
East of Gamston/North of Tollerton (2,500-4,000) (Policy 25)
Completions
- Zero
Future Years
- 2026/27 - 88
- 2027/28 - 176
Future Years (beyond plan period)
- 2028/29 - 220
- 2029/30 - 220
- 2030/31 - 220
- 2031/32 - 220
- 2032/33 - 220
- 2033/34 - 220
- 2034/35 - 220
- 2035/36 - 220
- 2036/37 - 220
- 2037/38 - 220
Total 2011-2028 (plan period) - 264
Total 2028-2038 (beyond plan period) - 2200
Infill and changes of use in broad locations
Completions
- Zero
Future Years
- 2024/25 - 210
- 2025/26 - 210
- 2026/27 - 210
- 2027/28 - 210
Future Years (beyond plan period)
- 2028/29 - 210
- 2029/30 - 210
- 2030/31 - 210
- 2031/32 - 210
- 2032/33 - 210
- 2033/34 - 210
- 2034/35 - 210
- 2035/36 - 210
- 2036/37 - 210
- 2037/38 - 210
Total 2011-2028 (plan period) - 840
Total 2028-2038 (beyond plan period) - 2100
Land rear of Mill Lane/The Old Park, Cotgrave
Completions
- Zero
Future Years
- 2023/24 - 20
- 2024/25 - 44
- 2025/26 - 44
- 2026/27 - 44
- 2027/28 - 29
Future Years (beyond plan period)
- Zero
Total 2011-2028 (plan period) - 181
Total 2028-2038 (beyond plan period) - 0
Land south of Hollygate Lane, Cotgrave
Completions
- Zero
Future Years
- 2023/24 - 40
- 2024/25 - 85
- 2025/26 - 55
Future Years (beyond plan period)
- Zero
Total 2011-2028 (plan period) - 180
Total 2028-2038 (beyond plan period) - 0
Land north of Rempstone Road, East Leake
Completions
- Zero
Future Years
- 2021/22 -
- 2022/23 -
- 2023/24 -
- 2024/25 -
- 2025/26 -
- 2026/27 -
- 2027/28 -
Future Years (beyond plan period)
- Zero
Total 2011-2028 (plan period) - 286
Total 2028-2038 (beyond plan period) - 0
Land north of of Lantern Lane, East Leake
Completions
- Zero
Future Years
- 2021/22 - 22
- 2022/23 - 44
- 2023/24 - 44
- 2024/25 - 44
- 2025/26 - 41
Future Years (beyond plan period)
- Zero
Total 2011-2028 (plan period) - 195
Total 2028-2038 (beyond plan period) - 0
Land off Nicker Hill, Keyworth
Completions
- 2020/21 - 4
Future Years
- 2021/22 - 22
- 2022/23 - 44
- 2023/24 - 44
- 2024/25 - 44
- 2025/26 - 2
Future Years (beyond plan period)
- Zero
Total 2011-2028 (plan period) - 160
Total 2028-2038 (beyond plan period) - 0
Land between Platt Lane and Station Road, Keyworth
Completions
- 2020/21 - 30
Future Years
- 2021/22 - 44
- 2022/23 - 44
- 2023/24 - 44
- 2024/25 - 25
Future Years (beyond plan period)
- Zero
Total 2011-2028 (plan period) - 187
Total 2028-2038 (beyond plan period) - 0
Land south of Debdale Lane Keyworth
Completions
- Zero
Future Years
- 2021/22 - 20
- 2022/23 - 44
- 2023/24 - 44
- 2024/25 - 44
- 2025/26 - 44
- 2026/27 - 25
Future Years (beyond plan period)
- Zero
Total 2011-2028 (plan period) - 221
Total 2028-2038 (beyond plan period) - 0
Hillside Farm, Keyworth
Completions
- Zero
Future Years
- 2026/27 - 20
- 2027/28 - 44
Future Years (beyond plan period)
- 2028/29 - 6
Total 2011-2028 (plan period) - 64
Total 2028-2038 (beyond plan period) - 0
Land north of Nottingham Road, Radcliffe on Trent
Completions
- Zero
Future Years
- 2026/27 - 44
- 2027/28 - 44
Future Years (beyond plan period)
- 2028/29 - 44
- 2030/31 - 44
- 2031/32 - 24
Total 2011-2028 (plan period) - 88
Total 2028-2038 (beyond plan period) - 112
Land adjacent to Grooms Cottage, Radcliffe on Trent
Completions
- Zero
Future Years
- 2021/22 - 15
- 2022/23 - 40
Future Years (beyond plan period)
- Zero
Total 2011-2028 (plan period) - 55
Total 2028-2038 (beyond plan period) - 0
Land off Shelford Road Radcliffe on Trent
Completions
- 2020/21 - 36
Future Years
- 2021/22 - 44
- 2022/23 - 44
- 2023/24 - 44
- 2024/25 - 44
- 2025/26 - 44
- 2026/27 - 44
- 2027/28 - 44
Future Years (beyond plan period)
- 2028/29 - 44
- 2029/30 - 12
Total 2011-2028 (plan period) - 344
Total 2028-2038 (beyond plan period) - 56
Land north of Grantham Road Radcliffe on Trent
Completions
- Zero
Future Years
- 2026/27 - 44
- 2027/28 - 44
Future Years (beyond plan period)
- 2028/29 - 44
- 2030/31 - 44
- 2031/32 - 44
- 2032/33 - 20
Total 2011-2028 (plan period) - 88
Total 2028-2038 (beyond plan period) - 152
72 Main Road, Radcliffe on Trent
Completions
- Zero
Future Years
- 2026/27 - 5
Future Years (beyond plan period)
- Zero
Total 2011-2028 (plan period) - 5
Total 2028-2038 (beyond plan period) - 0
The Paddocks, Nottingham Road Radcliffe on Trent
Completions
- Zero
Future Years
- 2026/27 - 31
- 2027/28 - 44
Future Years (beyond plan period)
- Zero
Total 2011-2028 (plan period) - 75
Total 2028-2038 (beyond plan period) - 0
Land west of Wilford Road, Ruddington
Completions
- Zero
Future Years
- 2021/22 - 15
- 2022/23 - 44
- 2023/24 - 44
- 2024/25 - 44
- 2025/26 - 20
Future Years (beyond plan period)
- Zero
Total 2011-2028 (plan period) - 167
Total 2028-2038 (beyond plan period) - 0
Land south of Flawforth Lane, Ruddington
Completions
- Zero
Future Years
- 2021/22 - 12
- 2022/23 - 44
Future Years (beyond plan period)
- Zero
Total 2011-2028 (plan period) - 56
Total 2028-2038 (beyond plan period) - 0
Land opposite Mere Way, Ruddington
Completions
- Zero
Future Years
- 2021/22 - 18
- 2022/23 - 44
- 2023/24 - 44
- 2024/25 - 44
- 2025/26 - 30
Future Years (beyond plan period)
- Zero
Total 2011-2028 (plan period) - 180
Total 2028-2038 (beyond plan period) - 0
Land at Asher Lane, Ruddington
Completions
- Zero
Future Years
- 2021/22 - 10
- 2022/23 - 44
- 2023/24 - 44
- 2024/25 - 44
- 2025/26 - 43
Future Years (beyond plan period)
- Zero
Total 2011-2028 (plan period) - 185
Total 2028-2038 (beyond plan period) - 0
Land east off Church Street, Cropwell Bishop
Completions
- Zero
Future Years
- 2021/22 - 16
- 2022/23 - 38
- 2023/24 - 31
Future Years (beyond plan period)
- Zero
Total 2011-2028 (plan period) - 85
Total 2028-2038 (beyond plan period) - 0
Land between Butt Lane and Closes Side Lane, East Bridgford
Completions
- Zero
Future Years
- 2022/23 - 15
- 2023/24 - 44
- 2024/25 - 29
Future Years (beyond plan period)
- Zero
Total 2011-2028 (plan period) - 88
Total 2028-2038 (beyond plan period) - 0
Land south of Butt Lane, East Bridgford
Completions
- Zero
Future Years
- 2024/25 - 20
- 2025/26 - 25
Future Years (beyond plan period)
- Zero
Total 2011-2028 (plan period) - 45
Total 2028-2038 (beyond plan period) - 0
Land east of Gypsum Way, Gotham
Completions
- Zero
Future Years
- 2023/24 - 26
- 2024/25 - 44
Future Years (beyond plan period)
- Zero
Total 2011-2028 (plan period) - 70
Total 2028-2038 (beyond plan period) - 0
Land north of Park Lane, Sutton Bonington
Completions
- Zero
Future Years
- 2024/25 - 10
- 2025/26 - 44
- 2026/27 - 26
Future Years (beyond plan period)
- Zero
Total 2011-2028 (plan period) - 80
Total 2028-2038 (beyond plan period) - 0
Former Bunny Brickworks
Completions
- Zero
Future Years
- 2026/27 - 12
- 2027/28 - 44
Future Years (beyond plan period)
- 2028/29 - 44
Total 2011-2028 (plan period) - 56
Total 2028-2038 (beyond plan period) - 44
Former Islamic Institute,
Flintham
Completions
- Zero
Future Years
- Zero
Future Years (beyond plan period)
- 2031/32 - 25
- 2032/33 - 44
- 2033/34 - 26
Total 2011-2028 (plan period) - 0
Total 2028-2038 (beyond plan period) - 95
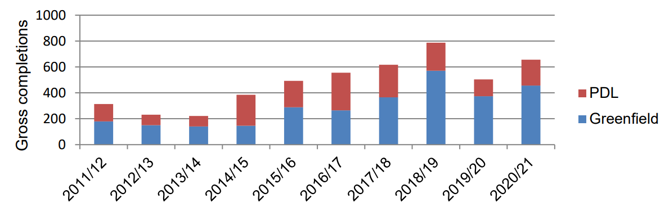
Gross Completions on Previously Developed Land (PDL)
5.6 One of the guiding principles of the NPPF is to encourage the effective use of land by reusing land that has been previously developed. The definition of Previously Developed Land (PDL) is included in the glossary of the NPPF.
5.7 During the monitoring period, 30% of new dwellings (gross) were built on PDL. This is a decrease from previous monitoring periods, with the number of houses built on PDL averaging at 41% since the start of the plan period. The previous years’ increase in percentage was due to a large number of dwellings coming forward on the allocated former colliery site at Cotgrave, which for a number of years was the largest site that was delivering units. Over the past couple of years a number of greenfield sites have also started delivering (e.g. which has meant the percentage of units delivered on previously developed land as a proportion of overall delivery has started tailing off. The Core Strategy allocations and draft allocations made through Local Plan Part 2 are predominantly greenfield sites. It is therefore anticipated that the percentage of houses developed on PDL will continue to decrease.
| Year | Gross completions | Gross completions on Previously Developed Land | % on Previously Developed Land |
|---|---|---|---|
| 2011/12 | 314 | 137 | 44% |
| 2012/13 | 232 | 96 | 41% |
| 2013/14 | 221 | 199 | 90% |
| 2014/15 | 385 | 236 | 61% |
| 2015/16 | 493 | 205 | 42% |
| 2016/17 | 555 | 290 | 52% |
| 2017/18 | 616 | 251 | 41% |
| 2018/19 | 818 | 217 | 27% |
| 2019/20 | 504 | 130 | 26% |
| 2020/21 | 656 | 200 | 30% |
| Total over plan period |
4794 | 1961 | 41% |
Completions on Greenfield and PDL Each Monitoring Year
Additional Gypsy and Traveller pitches over plan period
| Year | Permanent | Temporary | Total |
|---|---|---|---|
| 2011/12 | 1 | 0 | 1 |
| 2012/13 | 4 | 0 | 4 |
| 2013/14 | 0 | 0 | 0 |
| 2014/15 | 0 | 0 | 0 |
| 2015/16 | 0 | 0 | 0 |
| 2016/17 | 2 (see note below) | 1 | 3 |
| 2017/18 | 0 | 0 | 0 |
| 2018/19 | 6 | 0 | 6 |
| 2019/20 | 0 | 0 | 0 |
| 2020/21 | 0 | 0 | 0 |
| Total over plan period |
13 | 1 | 14 |
Note: The appeal Inspector for Stragglethorpe was of the view this pitch requirement was to meet existing (not new) need, therefore this would not count towards new supply. This was reinforced by Screveton appeal Inspector.
5.8 The 2010 Gypsy and Traveller Accommodation Assessment (GTAA) Update identified a need for 13 permanent Gypsy and Traveller pitches in Rushcliffe.
5.9 In terms of future provision, Policy 8 of the Local Plan Part 1: Rushcliffe Core Strategy states that sites for Gypsy and Traveller provision will be made in other Development Plan Documents and both the strategic site policies for the Sustainable Urban Extensions at South of Clifton and East of Gamston/North of Tollerton identify that these strategic sites are required to make appropriate provision. Outline planning permission for mixed use development, including 4 pitches has now been granted. Whilst this will provide for an additional 4 pitches, it is anticipated that these pitches will not form part of the 5 year land supply of traveller pitches until firm proposals are significantly progressed.
5.10 The 2016 South Nottinghamshire Gypsy & Traveller Accommodation Assessment (GTAA) 2014-2029 identifies a need for 4 Gypsy and Traveller pitches to be allocated between 2014 and 2029 in Rushcliffe with 3 of these required between 2014 and 2019. Since the publication of the 2016 GTAA, planning permission for an additional nine pitches has been granted. The permission for a single pitch at Stragglethorpe Lane however is not permanent and is restricted to a period of 4 years which ceases in October 2021. Cedar Lodge, Radcliffe on Trent was included in the 2016 GTAA study as a site with permission for 6 pitches. That original permission was granted in November 2012 and accommodated six households in total. Permission has subsequently been granted for an additional 6 caravans (comprising of 2 caravans for 2 additional households and 4 touring caravans) (16/00634/VAR). The Council had previously been of the opinion that this represented a pitch increase of 2 which should therefore be deducted from the overall pitch requirement identified in the GTAA. However, the Planning Inspector for the recent Stragglethorpe appeal was of the view that although this only represented a
theoretical increase as in reality it does not provide new pitches to meet general need as it is only providing for an expansion of an existing site.
5.11 As the permission for the single pitch at Stragglethorpe Lane, Cotgrave is due to cease use in October 2021, it cannot be considered as part of the five year supply.
5.12 Permission for a permanent site at Spring View, Screveton was granted on appeal this monitoring year (appeal decision date 17 December 2018). The site is limited to 6 pitches. This meets a newly identified need.
| Year | Permanent | Temporary | Total |
|---|---|---|---|
| 2011/12 | 1 | 0 | 1 |
| 2012/13 | 4 | 0 | 4 |
| 2013/14 | 0 | 0 | 0 |
| 2014/15 | 0 | 0 | 0 |
| 2015/16 | 0 | 0 | 0 |
| 2016/17 | 2 (see note below) | 1 | 3 |
| 2017/18 | 0 | 0 | 0 |
| 2018/19 | 6 | 0 | 6 |
| 2019/20 | 0 | 0 | 0 |
| 2020/21 | 0 | 0 | 0 |
| Total over plan period |
13 | 1 | 14 |
Affordable Housing Completions 2020/21
5.13 There were 92 affordable housing completions in the Borough over the monitoring year, equating to 14% of annual completions. This brings the total number to 819 since the start of the plan period, equating to 18% of total completions.
| Year | Permanent | Temporary | Total |
|---|---|---|---|
| 2011/12 | 1 | 0 | 1 |
| 2012/13 | 4 | 0 | 4 |
| 2013/14 | 0 | 0 | 0 |
| 2014/15 | 0 | 0 | 0 |
| 2015/16 | 0 | 0 | 0 |
| 2016/17 | 2 (see note below) | 1 | 3 |
| 2017/18 | 0 | 0 | 0 |
| 2018/19 | 6 | 0 | 6 |
| 2019/20 | 0 | 0 | 0 |
| 2020/21 | 0 | 0 | 0 |
| Total over plan period |
13 | 1 | 14 |
Economic Indicators
Employment Development
5.14 There were 1 completion for employment development over the monitoring thresholds (0.01ha or 100 square metres) during the monitoring period. Cumulatively this resulted in an additional 2,100 square metres of floorspace.
5.15 There is a significant amount of employment land available, due to unimplemented permissions for larger mixed use schemes (e.g. Former RAF Newton and land north of Bingham). A number of these are allocated sites in the Core Strategy.
Total Additional Floorspace (Gross)
| Year | B1a (square metres) | B1b (square metres) | Total (square metres) | B1c (hectares) | B1 mix (hectares) | B2 (hectares) | B8 (hectares) | Total (hectares) |
|---|---|---|---|---|---|---|---|---|
| 2011/12 | 421 | - | 421 | 0.01 | - | - | 1.3 | 1.31 |
| 2012/13 | - | - | - | - | - | - | 0.01 | 0.01 |
| 2013/14 | 1,675 | - | 1,675 | - | - | - | 0.01 | 0.01 |
| 2014/15 | 930 | - | 930 | 0.012 | - | - | - | 0.012 |
| 2015/16 | 498 | - | 498 | 0.04 | - | 0.11 | 0.04 | 0.19 |
| 2016/17 | 401 | - | 401 | - | - | - | - | - |
| 2017/18 | 1,251 | - | 1,251 | 0.02 | - | 0.03 | 0.01 | 0.06 |
| 2018/19 | 1,655 | - | 1,655 | 1.05 | - | 0.24 | 0.870 | 2.16 |
| 2019/20 | 667 | - | 667 | - | - | - | - | - |
| 2020/21 | 2,100 | - | 2,100 | - | - | - | - | - |
| Total over plan period |
9,598 | - | 9,598 | 1.13 | 0.00 | 0.38 | 2.24 | 3.75 |
Total Additional Floorspace (m2) (net)
| Year | B1a (square metres) | B1b (square metres) | Total (square metres) | B1c (hectares) | B1 mix (hectares) | B2 (hectares) | B8 (hectares) | Total (hectares) |
|---|---|---|---|---|---|---|---|---|
| 2011/12 | 421 | - | 421 | 0.01 | - | - | 1.3 | 1.31 |
| 2012/13 | - | - | - | - | - | - | 0.01 | 0.01 |
| 2013/14 | 1,218 | - | 1,218 | - | - | -0.05 | 0.01 | -0.04 |
| 2014/15 | 930 | - | 930 | - | - | - | - | 0 |
| 2015/16 | 13 | - | 13 | -1.76 | - | 0.11 | 0.04 | -1.61 |
| 2016/17 | -515 | - | -515 | -0.1 | - | - | - | -0.1 |
| 2017/18 | 1,251 | - | 1,251 | 0 | - | 0.03 | 0.01 | 0.06 |
| 2018/19 | 1,655 | - | 1,655 | 1 | - | 0.24 | 0.870 | 2.16 |
| 2019/20 | 100 | - | 100 | - | - | - | - | 0 |
| 2020/21 | 2,100 | - | 2,100 | - | - | - | - | 0 |
| Total over plan period |
7,173 | - | 7,173 | -0.78 | 0.00 | 1.63 | 2.24 | 3.752 |
Employment Sites (2020/21)
| Completions 2020/21 | Area (hectares) | Floorspace (square metres) | Use Class | PPDL/GF |
|---|---|---|---|---|
| West Bridgford Melton Road 18/02853/FUL |
- | 2,100 | B1(a) | GF |
| Total | - | 2,100 | - | - |
Total Amount of Additional Floorspace on PDL 2020/21
| Unit | B1a | B1b | Total floorspace (B1a and B1b) | B1c | B2 | B8 | Total area (B1c, B2 and B8) |
|---|---|---|---|---|---|---|---|
| Gross square metres on PDL |
- | - | - | - | - | - | - |
| % on PDL |
- | - | - | - | - | - | - |
Available Employment Land
5.16 Policy 5 of the Core Strategy establishes the strategic requirements for employment provision and economic development, including minimum employment space and land requirements over the plan period (to 2028). The policy identifies that there should be a minimum 67,000m2 of new office floorspace (in Use Classes B1a and B1b) and a minimum of 20ha of employment land for industrial and warehouse uses.
5.17 The three strategic sites allocated by the Core Strategy in locations around the main urban area of Nottingham will provide for around 44ha of new employment development.
5.18 Elsewhere in the borough, the strategic allocations at the former Cotgrave Colliery, at the former RAF Newton and at Land North of Bingham will provide for around a further 26.5ha of employment land. Core Strategy policy allows for a mix of B1 (business), B2 (general industrial), and B8 (storage and distribution). There are also some none-strategic employment and mixed use sites allocated within Local Plan Part 2 at Bingham, Bunny, Cotgrave, Keyworth and Radcliffe on Trent.
Core Strategy - Remaining Strategic Allocations
| Allocation | Area (hectares) | Floorspace (m2) | Use Class |
|---|---|---|---|
| Melton Road, Edwalton (Policy 20) Remaining allocation |
1 | - | B1 or non-B use generating employment |
|
Land North of Bingham 10/01962/OUT |
15.6 | - | B1, B2, B8 |
|
Former RAF 10/02105/OUT |
10.6 | - | B1, B2, B8 |
|
Former Cotgrave 10/00559/OUT |
2.0 | - | - |
| South of Clifton (Policy 24) |
20 | - | Employment generating use |
| East of Gamston/North of Tollerton (Policy 25) Remaining Allocation |
12 | - | B1, B2, B8 |
Local Plan Part 2 employment or mixed use sites
| Site | Area (hectares) | Floorspace (m2) | Use Class |
|---|---|---|---|
| Bingham Chapel Lane (west) |
0.9 | - | B1, B2, B8 |
| Bunny Brickworks |
3 | - | B1, B2, B8 |
| Cotgrave Hollygate Lane |
1.8 | - | B1, B2, B8 |
| Keyworth Platt Lane |
3 | - | B1, B2, B8 |
| Radcliffe on Trent Nottingham Road |
3 | - | B1, B2, B8 |
| Total Remaining LPP2 Allocations |
11.7 | - | - |
Windfall Sites (Unimplemented)
| Site | Area (hectares) B1c, B2 and B8 |
Floorspace (m2) B1 (a) and B1 (b) |
Use Class |
|---|---|---|---|
| Car Colston Toll Bar Farm, Fosse Way |
1.05 | - | B mix |
| Costock Barrington House Leake Road |
- | 655 | B1 (a) |
| Cropwell Butler Upper Saxondale Business Park |
-0.1 | - | Loss of B2 |
| Keyworth 2-4 Main Street |
- | -154 | Loss of B1(a) |
| Ruddington Oak House Ruddington Fields Business Park |
- | -1,700 | Loss of B1(a) |
| Ruddington Kempson Court, Kempson Street |
- | -155 | Loss of B1(a) |
| Thrumpton Wood Farm Court, Church Lane |
0.38 | - | B8 |
| West Bridgford Index Computer Supplies |
- | -164 | Loss of B1(a) |
| West Bridgford 83 Melton Road |
- | -102 | Loss of B1(a) |
| West Bridgford Unit B, Nottingham South And Wilford Industrial Estate |
- | -600 | Loss of B1(a) |
| West Bridgford Wellbeing Clinic Ltd |
- | 200 | B1(a) |
| Whatton Riverbank Business Park (3) |
- | 600 | B1(a) |
| Whatton Riverbank Business Park (1) |
0.8 | - | B mix |
| Total Windfall (Unimplemented) |
2.13 hectares (Gross) 2.03 hectares (Net) |
1,455m2 (Gross) -1,420m2 (Net) |
- |
Town Centre Uses
5.19 A total of 1,579m2 of new retail space was delivered, at the strategic allocation on Melton Road Edwalton and at Cotgrave.
Retail Completions (gross)
| Year | A1 | A2 | A3 | B1a | D2 | Total |
|---|---|---|---|---|---|---|
| 2011/12 | 1,321 | - | - | 421 | 55 | 1,797 |
| 2012/13 | 519 | - | - | - | - | 519 |
| 2013/14 | - | - | 844 | 1,675 | - | 2,519 |
| 2014/15 | 126 | - | - | - | - | 126 |
| 2015/16 | 2,474 | - | - | - | - | 2,474 |
| 2016/17 | 1,770 | - | - | - | 2,105 | 3,875 |
| 2017/18 | 12,811 | 533 | - | 1,251 | - | 14,661 |
| 2018/19 | 1,579 | - | - | - | - | 1,579 |
| 2019/20 | 57 | - | 387 | - | - | 444 |
| 2020/21 | 2,002 | - | 948 | - | - | 2,950 |
| Total | 22,659 | 533 | 2,179 | 3,347 | 2,160 | 30,944 |
Gains (2020/21)
| Site | Floorspace (square metres) | Use Class |
|---|---|---|
| Cotgrave Cotgrave town centre 19/02209/FUL |
814 | A1 |
| West Bridgford Melton Road 19/01507/FUL |
223 | A1 |
| West Bridgford Melton Road 19/01507/FUL |
948 | A3 |
| West Bridgford Land South of Landmere Lane 18/00460/HYB |
965 | A1 |
Losses (2020/21) - No retail losses during 2020/21 monitoring year.
Environmental Indicators
Number of planning permissions granted contrary to Environment Agency on Flooding and Water Quality grounds
5.20 During the monitoring period, there have not been any developments granted planning permission contrary to Environment Agency advice based on water quality or flooding grounds.
Permissions Granted Contrary to EA Advice
- Flooding - 0
- Water Quality - 0
- Total - 0
5.21 Within areas at potential risk from flooding, where there is already existing development, such as the parts of West Bridgford adjacent to the River Trent, the Environment Agency issues advisory notes to applicants indicating how flooding concerns can be minimised.
Renewable Energy Generation
5.22 There were two renewable energy installations granted or permitted during the monitoring period over the qualifying threshold, with a total generation rate of 0.9MW.
Summary of renewable permissions granted (capacity MW)
| Year | Solar | Wind | Hydro | Biomass | Total |
|---|---|---|---|---|---|
| 2011/12 | 0 | 0 | 0 | 0 | 0 |
| 2012/13 | 0 | 0 | 0 | 0 | 0 |
| 2013/14 | 0 | 0 | 0.5 | 0 | 0.5 |
| 2014/15 | 19.8 | 0 | 0.5 | 0 | 20.3 |
| 2015/16 | 9.6 | 0.26 | 0 | 1 | 10.86 |
| 2016/17 | 0 | 0 | 0 | 0 | 0 |
| 2017/18 | 0.025 | 0 | 0 | 0 | 0.025 |
| 2018/19 | 0 | 0 | 0 | 0 | 0 |
| 2019/20 | 0 | 0 | 0 | 0 | 0 |
| 2020/21 | 0.62 | 0 | 0 | 0 | 0.62 |
| Total | 30.02 | 0.26 | 1 | 1 | 32.31 |
Summary of renewable installations (capacity MW)
| Year | Solar | Wind | Hydro | Biomass | Total |
|---|---|---|---|---|---|
| 2011/12 | 0 | 0 | 0 | 0 | 0 |
| 2012/13 | 0 | 0 | 0 | 0 | 0 |
| 2013/14 | 9.73 | 0 | 0 | 0 | 9.73 |
| 2014/15 | 10.023 | 0.25 | 0 | 0 | 10.273 |
| 2015/16 | 10.00 | 0 | 0.5 | 0 | 10.50 |
| 2016/17 | 13.60 | 0 | 0 | 7.00 | 20.60 |
| 2017/18 | 7.80 | 0 | 0 | 0 | 7.80 |
| 2018/19 | 0 | 0 | 0 | 0 | 0 |
| 2019/20 | 0 | 0 | 0 | 0 | 0 |
| 2020/21 | 0.90 | 0 | 0 | 0 | 0.90 |
| Total | 60.15 | 0.25 | 0.50 | 7 | 59.80 |
Carbon Dioxide Emissions (2011 – 2020)
Over the plan period there has been an overall decrease in carbon dioxide (CO2) emissions for the Borough. The latest statistics published in 2021 contain data up to 2020 Local Authority CO2 emissions estimates 2005-2020 (kiloton CO2) - Full dataset).
| Year | Solar | Wind | Hydro | Biomass | Total |
|---|---|---|---|---|---|
| 2011/12 | 0 | 0 | 0 | 0 | 0 |
| 2012/13 | 0 | 0 | 0 | 0 | 0 |
| 2013/14 | 9.73 | 0 | 0 | 0 | 9.73 |
| 2014/15 | 10.023 | 0.25 | 0 | 0 | 10.273 |
| 2015/16 | 10.00 | 0 | 0.5 | 0 | 10.50 |
| 2016/17 | 13.60 | 0 | 0 | 7.00 | 20.60 |
| 2017/18 | 7.80 | 0 | 0 | 0 | 7.80 |
| 2018/19 | 0 | 0 | 0 | 0 | 0 |
| 2019/20 | 0 | 0 | 0 | 0 | 0 |
| 2020/21 | 0.90 | 0 | 0 | 0 | 0.90 |
| Total | 60.15 | 0.25 | 0.50 | 7 | 59.80 |
Core Strategy Indicators Summary
Policy 2: Climate Change
| Indicator | Commentary |
|---|---|
| Per capita carbon dioxide (CO2) levels | There has been an overall decrease in carbon dioxide emissions over the plan period. This does fluctuate year on year and there is no consistent year on year decrease. |
| Energy capacity of new facilities | Renewable energy permissions for solar, wind and biomass have fluctuated during the plan period. There has been an overall decline in permissions for wind and solar projects in recent years. |
| Number of planning permissions granted contrary to Environment Agency advice |
Zero |
| Number of new sustainable drainage system (SuDS) and location |
The following developments that have commenced during the plan period contain new Sustainable Drainage Systems (SuDS):
|
Policy 3: Spatial Strategy
| Indicator | Commentary |
|---|---|
| Net additional homes | 4,586 homes have been completed since the start of the plan period |
| Available housing land (homes with planning permission) |
4,488 homes have planning permission (as of 31 March 2021) |
| Five year housing supply | 9.2 year housing supply (April 2021-March 2026) |
| Affordable housing delivery | 819 new affordable homes have been completed since the start of the plan period. This equates to 18% of overall completions. 91 affordable units were completed over the last monitoring year. Between 2011-2018 the Core Strategy target was completion of 190 affordable dwellings. This target was exceeded with 281 affordable units built over this period. The target for 2018-2023 is for 1,850 new affordable units. 410 affordable units have so far been built over this period. |
Policy 4: Nottingham-Derby Green Belt
| Indicator | Commentary |
|---|---|
| Location and area of land removed from the Green Belt |
With the adoption of the Core Strategy, the following sites were removed from the Green Belt:
As a result, a total of 670 hectares of land has been removed from the Green Belt. A further 326 Hectares of land from the green belt was released |
Policy 5: Employment Provision
| Indicator | Commentary |
|---|---|
|
Available supply office floorspace Available supply of industrial and |
Policy 5 of the Core Strategy The three strategic sites allocated by The strategic allocations at the former Windfall sites also contribute towards |
|
Net addition of office (B1a) floorspace. Net addition of research and |
Since the start of the plan period there
|
Policy 6: Role of Town and Local Centres
| Indicator | Commentary |
|---|---|
| Net addition of retail floorspace and other town centre uses |
Since the start of the plan period, a gross figure of 22,659m2 of A1 (shops), 533m2 of A2 (professional and financial services) and 2,179m2 of A3 (restaurants and cafes) has been developed. |
| Proportion of A1 land uses in primary shopping frontages |
The last surveys were undertaken in 2019. 50% of primary shopping frontages were in A1 use. |
Policy 7: Regeneration
| Indicator | Commentary |
|---|---|
| Completion of sites, or specific elements of sites. |
All 463 dwellings have now been completed on the identified regeneration site at the Former Cotgrave Colliery. Part of the employment element of the mixed-use scheme has also been completed. |
Policy 8: Housing Size, Mix and Choice
| Indicator | Commentary |
|---|---|
| Permissions and completions by dwelling size and type. |
Between 2011 and 2021, the percentage of all new dwellings built have comprised of:
|
This is only monitored at the point of completion. It is not possible to monitor this
indicator on the granting of planning permission for the following reasons. Firstly, the
required level of detail is not always supplied for outline approval. Secondly,
permissions are frequently superseded or part superseded which would result in
double counting as it is not evident which permission will be implemented until
manual site surveys are carried out. This would result in substantial abortive work.
Policy 9: Gypsies, Travellers and Travelling Showpeople
| Indicator | Commentary |
|---|---|
| Number of traveller pitches granted planning permission and also implemented. |
13 permanent pitches and 1 temporary pitch implemented since the start of the plan period. |
Policy 10: Design and Enhancing Local Identity
None set.
Policy 11: Historic Environment
| Indicator | Commentary |
|---|---|
| Number of heritage assets at risk |
There are currently 7 heritage assets on Historic England’s risk register:
The County Council are in the process of reviewing the buildings at risk register for grade 2 listed buildings, therefore there is no information available. |
Policy 14: Managing Travel Demand
| Indicator | Commentary |
|---|---|
| Number and proportion of trips by different transport modes |
No data available at present. |
| Number of travel plans required. | A number of developments across Rushcliffe are supported by travel plans and contributions secured for a travel plan coordinator. |
Policy 16: Green Infrastructure, Landscape, Parks and Open Space
| Indicator | Commentary |
|---|---|
| Accessibility of Green Infrastructure | No detailed indicator. |
Policy 17: Biodiversity
| Indicator | Commentary |
|---|---|
| Net change in Local Wildlife Site (LWS) |
There has been a net increase of 16 LWS designated since the start of the plan period.
|
Local Plan Part 2 Indicators Summary
Policies 2 to 10
| Indicator | Commentary |
|---|---|
| Delivery of none-Strategic allocation in line with housing trajectory contained within Local Plan Part 2 |
|
Policy 12 Housing Standards
| Targets | Indicator | Commentary |
|---|---|---|
| 1% of homes on housing developments over 100 comply with M4(3(a) of the Building Regulations |
Developments which comply with requirement M4(3)(a) of the Building Regulations |
None built during 2020- 21 Secured by planning condition on qualifying sites |
| 100% of all new dwellings meeting higher optional water efficiency standards |
Developments that meet the higher optional technical housing standard for water consumption |
None built during 2020- 21 Secured by planning condition on qualifying sites |
Policy 13 Self and Custom Build Housing Provision
| Targets | Indicator | Commentary |
|---|---|---|
| The granting of planning permission for a sufficient quantity of self and custom build plots to meet local need | Annual monitoring of the number of plots with planning permission available capable of accommodating self and custom build homes |
2018-21 Plots granted planning permission - 101 |
Policy 14 Specialist Residential Accommodation
| Targets | Indicator | Commentary |
|---|---|---|
| None | Number of Planning permissions and completions for specialist accommodation |
2020-21 Completions |
Policy 15 Employment development
| Targets | Indicator | Commentary |
|---|---|---|
| No target | Annual monitoring of the amount of employment land permitted and completed over 100 square metres floorspace or 0.1 hectares total area |
Monitored as part of Core Strategy indicators |
Policy 16 Renewable Energy
| Targets | Indicator | Commentary |
|---|---|---|
| To reduce per capita carbon dioxide (CO2) emissions | Per capita CO2 levels | Monitored as per Core Strategy indicators |
| Increase renewable power generation | Annual monitoring of new renewable energy generation completed over 0.1Mw (megawatt) | Monitored as per Core Strategy indicators |
Policy 17 Managing Flood Risk
| Targets | Indicator | Commentary |
|---|---|---|
| No planning applications approved | Number of planning applications in flood risk areas approved against Environment Agency advice. | Zero |
Policy 18 Surface Water Management
| Targets | Indicator | Commentary |
|---|---|---|
| No target | Number of developments incorporating sustainable drainage systems |
See core strategy monitoring indicator |
| No planning applications approved |
Number of planning applications approved against the advice of the Lead Local Flood Authority | See core strategy monitoring indicator |
Policy 23 Former Bunny Brickworks
| Targets | Indicator | Commentary |
|---|---|---|
| Delivery of allocation promoted in policy |
Completion of specific land uses allowed by Policy 23. | Outline Planning application under consideration |
Policy 24 Redevelopment of the Former Islamic Institute Flintham
| Targets | Indicator | Commentary |
|---|---|---|
| Delivery of allocation promoted in policy |
Completion of specific land uses allowed by Policy 24. |
Planning permission expired |
Policy 25 Development within District and Local Centres
| Targets | Indicator | Commentary |
|---|---|---|
| Maintaining appropriate balance of uses as outlined within policy 25 |
Annual monitoring of percentage of units within each use classes within primary and secondary frontages Vacancy rates of shop units |
Not monitored during monitoring period due to COVID 19 restrictions |
Policy 26 Development within Centres of Neighbourhood Importance
| Targets | Indicator | Commentary |
|---|---|---|
| Maintain and improve vitality and viability of identified centres |
Percentage of units within each use classes Vacancy rates of shop units |
Not monitored during monitoring period due to COVID 19 restrictions |
Policy 27 Main Town Centre Uses outside of District and Local Centres
| Targets | Indicator | Commentary |
|---|---|---|
| No target | Amount of retail development permitted and completed over 100 square metres floorspace outside Local or District Centres |
Melton Road Edwalton. 2950 metres squared A1/A3 completed |
Policy 30 Protection of community facilities
| Targets | Indicator | Commentary |
|---|---|---|
| No net loss in number of community facilities |
Number of community facilities gained or lost on an annual basis | None during the monitoring period |
Policy 31 Sustainable Tourism and Leisure
| Targets | Indicator | Commentary |
|---|---|---|
| No target | Number of planning permissions and completions of new tourist facilities and accommodation |
Not monitored |
Policy 32 Recreational Open Space
| Targets | Indicator | Commentary |
|---|---|---|
| Increase in open space | New open space committed within section 106 planning obligations agreements |
There has been provision of a number of areas of formal and informal open space to serve new development during the monitoring period. |
| No net loss in open space | Net change in certain types of open space |
No loss identified during the monitoring period |
Policy 33 Local Green Space
| Targets | Indicator | Commentary |
|---|---|---|
| No net loss of Local Green Space | Local Green Space | No loss of Local Green Space during monitoring period |
Policy 34 Green Infrastructure and Open Space Assets
| Targets | Indicator | Commentary |
|---|---|---|
| No net loss | Net change in certain types of Green Infrastructure |
Certain aspects monitored |
Policy 36 Designated Nature Conservation Sites
| Targets | Indicator | Commentary |
|---|---|---|
| No applications approved against Natural England Advice |
Number of planning applications approved against Natural England advice |
None |
| No decline in site condition |
Natural England and Nottinghamshire Biological Records Office site condition information |
4 out of 17 main habitats within the SSSIs (sites of special scientific interest) are in an unfavourable condition and not recovering |
Policy 41 Air Quality
| Targets | Indicator | Commentary |
|---|---|---|
| No target | Number of Air Quality Management Zones (AQMA) |
2 AQMAs |
6. LDF Sustainability Appraisal (SA) Monitoring Indicators
Sustainability Appraisal Indicators to monitor Core Strategy policies
Under the SEA Directive, the significant environmental effects of the DPD must be monitored. It requires monitoring to identify unforeseen adverse effects arising from the plan to enable remedial action to be taken.
Significant effects indicators should be developed to ensure a robust assessment of policy implementation. The SA monitoring will cover significant social, economic and environmental effects.
Government guidance on the local plan monitoring proposes three types of indicators for inclusion in the Annual Monitoring Reports:
- Contextual indicators which provide information on the wider social, environmental and economic situation;
- Output indicators which are used to assess the performance of policies;
- Significant effects indicators which are used to assess the significant social, environmental and economic effects of the policies (and should be derived from the SA findings).
Appendix 6 of the Core Strategy Sustainability Appraisal presents the monitoring arrangements proposed. Ongoing review of environmental targets and indicators will be undertaken as consequential DPDs and revisions to the Core Strategy are prepared.
1. Housing
Population (by group)
Index of Multiple Deprivation:
- 318 out of 326 (2010)
- 314 out of 326 (2019) (latest)
Population:
- 111,200 (2011),
- 119,000 (2021) (latest)
Working age population:
- 70,100 [63%] (2011),
- 70,000 [62%] (2014),
- 70,300 [61%] (2015),
- 70,300 [61%] (2016),
- 70,300 [61%] (2017),
- 73,700 (2020) (latest)
Population aged 65+:
- 20,620 [19%] (2011),
- 22,931 [20%] (2014),
- 23,361 [20%] (2015),
- 23,796 [21%] (2016),
- 24,311 [21%] (2017),
- 25,500 [21%] 24,900 [21%] (2020) (latest)
%BME: 9.7% (2011)
Number of housing completions (total)
- 4,586 (2011 to 2021)
- 650 (2020/21)
- 494 (2019/20)
- 760 (2018/19)
- 593 (2017/18)
- 528 (2016/17)
- 487 (2015/16)
- 373 (2014/15)
- 199 (2013/14)
- 209 (2012/13)
- 293 (2011/12)
Number of housing completions (affordable)
- 819 (18% of overall comps) (2011 to 2021)
- 92 (14%) (2020/21)
- 108 (22%) (2019/20)
- 210 (28%) (2018/19)
- 128 (22%) (2017/18)
- 78 (15%) (2016/17)
- 96 (20%) (2015/16)
- 51 (14%) (2014/15)
- 1 (0.5%) (2013/14)
- 42 (20%) (2012/13)
- 13 (4%) (2011/12)
Number of housing completions (by dwelling type and size)
2011 – 2021
- 1 Bed House= 43 [1%]
- 2 Bed House= 519 [14%]
- 3 Bed House= 917 [25%]
- 4+ Bed House= 1512 [40%]
- 1 Bed Flat= 208 [8%]
- 2 Bed Flat= 324 [11%]
- 3 Bed Flat= 15 [1%]
Number and area of housing completions on previously developed land
- 2011 - 2021: 1,961 [41% of total completions]
- 2020 - 2021: 200 [30% of annual completions]
Average house prices
Increase by 64% (2011-2021)
- £308,171 (March 2021))
- £197,000 (April 2011)
(Land Registry UK House Price Index)
Number of homelessness
Note: Definitions of homelessness changed with the introduction of the Homelessness Reduction Act. New definition is “Homeless + priority need + unintentionally homeless (acceptance)”
- 6 (2020 – 2021)
- 4 (2019 – 2020)
- 3 (2018–2019)
- 28 (2017-2018)
- 22 (2016-2017)
- 20 (2015-2016)
- 14 (2014-2015)
- 13 (2013-2014)
- 33 (2012-2013)
- 34 (2011-2012)
Number of vacant dwellings
- 2018/19 1,231 all vacant properties (latest date available at time of publication)
- 2011: 1,353
- 2012: 1,375
- 2013: 1,270
- 2014: 1,130
- 2015: 1,064
- 2016: 1,147
- 2017: 1,128
- 2018: 1,169
Number of new gypsy and traveller pitches
2020/21: 0
Over plan period: 14
- 2011/12: 1
- 2012/13: 4
- 2013/14: 0
- 2014/15: 0
- 2015/16: 0
- 2016/17: 3
- 2017/18: 0
- 2018/19: 6
- 2019/20: 0
- 2020/21: 0
2. Health
Number of doctor surgeries, health facilities, community facilities and leisure centres
2021
Doctor Surgeries: 17 (one in Kegworth)
Health Facilities: 5
Community Centres: 5
Leisure Centres: 5
Life expectancy at birth
2016-2018
- Male: 81.7
- Female: 84.6
2008-2010 (baseline)
- Male: 80.1
- Female: 83.6
Resident’s participation in sport
Resident’s participation in sport
Number of people playing sport for at least 30 minutes at moderate intensity at least once a week:
- 2011/12: unknown
- 2012/13: 43.7%
- 2013/14: 41.6%
- 2014/15: 44.8%
- 2015/16: 48.5%
2015/16:
- Inactive (less than 30 mins a week): 20.2%
- Fairly Active (30-149 mins a week): 17.1%
- Active (150+ mins a week): 62.7%.
2016/17:
- Inactive (less than 30 mins a week): 20.3%
- Fairly Active (30-149 mins a week): 10.9%
- Active (150+ mins a week): 68.8%
2017/18:
- Inactive (less than 30 mins a week): 17%
- Fairly Active (30-149 mins a week): 12.5%
- Active (150+ mins a week): 70.5%
2018/19*:
- Inactive (less than 30 mins a week): 23.7%
- Fairly Active (30-149 mins a week): 12.4%
- Active (150+ mins a week): 63.9%
3. Heritage
Number of open spaces managed to Green Flag award standard
- 2021: 1
- 2011: unknown
Number of museums
2019
4 in total:
- Flintham Museum
- Nottingham Transport Heritage Centre and Great Central Railway
- Ruddington Framework Knitters Museum
- Ruddington Village Museum
4. Crime
Crime (by type)
2018
- All Crime: 4599
- Burglary in a dwelling: 480
- Criminal damage: 508
- Business crime (shoplifting): 1248
- Robbery: 37
- Violence against a person: 1140
5. Social
Number of community centres, leisure centres and libraries
2021
- Community Centres: 5 (does not include village halls, or private leisure facilities)
- Leisure Centres: 5 (does not include village halls, or private leisure facilities)
- Libraries: 9
6. Environmental, Biodiversity and Green Infrastructure, and also, 7. Landscape
Amount of greenfield land lost to new development
Dwellings built on greenfield land:
- 2020 – 2021: 26.54 ha [69% of all dwellings)
Area of new open space
No data
Number and area of Local Nature Reserves
2021
- 8 (87 hectares) (2021)
Number and area of National Nature Reserves
2018 - zero
Number and area of Local Wildlife Sites
- 2021
Total LWS: 222 (1,908ha) - 2011: 52/224 (23%) under positive
conservation management - 2017: 77/222 (34%) under positive
conservation management
Area of woodland
- 575 hectares (ha) woodland (1%)
Number and area of Conservation Areas
- 2021
30 Conservation Areas [total area: 1,078 ha]
Number of listed buildings
- March 2021
Grade I: 35
Grade II*: 22
Grade II: 625
Heritage at Risk
- March 2021
Total: 7 at risk (using national Historic England Heritage at Risk register data).
Number of Registered Parks and Gardens
2019
4 Registered Parks and Gardens [256.3ha]
- Flintham Hall
- Holme Pierrepont Hall
- Kingston Hall
- Stanford Hall
Number of Scheduled Ancient Monuments (SAM)
- 2021
27 SAMs in total
8. Natural Resources and Flooding
Planning permissions granted contrary to the advice of the Environment Agency
- Zero during plan period
Households in Flood Zones 2 or 3 (with no flood protection measures)
(no data on houses without flood protection measures)
As of 2014 - EA do not expect the figures to have changed since:
- All Houses in FZ3: 7,914
- All Houses in FZ2: 9,706
Areas covered by Flood Zones 2 or 3 (with no flood protection measures)
- No data
9. Waste and also, 10. Energy and Climate Change
CO2 (carbon dioxide) emissions per capita
- 2011: 7.2
- 2012: 7.3
- 2013: 7.4
- 2014: 6.8
- 2015: 6.9
- 2016: 6.3
- 2017: 6.4
- 2018: 6.2
- 2019: 6.0
- 2019: 5.2 (latest available data)
Energy per meter (by type)
2011
Domestic:
- Electricity (4,231 KWh)
- Gas (16,651 KWh)
Non-Domestic:
- Electricity (70,955 KWh)
- Gas (1,157,517 KWh)
2018 (last available data)
Domestic:
- Electricity (3,822 KWh)
- Gas (15,532)
Non Domestic:
- Electricity (59,752 KWh)
- Gas (1,327,132)
Energy consumed (by type)
(2016)
- Coal: 31.0 GWh
- Manufactured fuels: 4.6 GWh
- Petroleum: 954.9 GWh
- Gas: 1,021.7 GWh
- Electricity: 408.1 GWh
- Bio-energy & wastes: 28.5 GWh
Renewable energy capacity installed (by type)
- 2011/12: 0.00 MW
- 2012/13: 0.00 MW
- 2013/14: 9.73 MW (all solar)
- 2014/15: 10.28 MW (10.03 solar + 0.25 wind)
- 2015/16: 10.50 MW (10.00 solar + 0.50 hydro)
- 2016/17: 20.60 MW (13.60 solar + 7.00 bio)
- 2017/18: 7.80 MW (all solar)
- 2018/19: 0.00MW
- 2019/20: 0.00MW
- 2020/21: 0.9MW (all solar)
Number of new waste management facilities (by type)
Zero
11. Transport
Accessibility to key facilities
% users within 30 minutes of town centres by public transport/walk
- 2014 (84%)
- 2015 (77%)
- 2016 (81%)
- 2017 (no data)
- 2018 (no data)
- 2019 (no data)
- 2020 (no data)
- 2021 (no data)
Railway station usage
Total Entries and Exits
2010/11
- Aslockton: 14,644
- Bingham: 34,512
- East Midlands Parkway: 219,734
- Elton and Orston: 84
- Radcliffe: 8,724
2020/21
- Aslockton: 3,756 (-74%)
- Bingham:14,442 (-58%)
- East Midlands Parkway: 39,350 (-82%)
- Elton and Orston: 12 (-86%)
- Radcliffe: 1,952 (-76%)
Figures in brackets are the percentage change since 2010/11
Proportion of households with hourly or better daytime bus service to district or city centre
% users within 30 minutes of town centres by public transport/walk
- 2021 (no data)
- 2014 (84%)
- 2015 (77%)
- 2016 (81%)
- 2017 (no data)
- 2018 (no data)
- 2019 (no data)
- 2020 (no data)
Number of public transport trips
Greater Nottingham Area combined number of passenger journeys by bus and tram
- 2018/19: 82.75 million (+9% since
- 2010/11). No more up to date data
- 2017/18: 81.93 million
- 2016/17: 81.48 million
- 2011/12: 76.21million
- 2010/11: 75.90 million
Plan area-wide traffic growth
Greater Nottingham (traffic miles travelled)
- 2017: 1,764 million miles (+1.1% since previous year) Last published data
- 2016: 1,745 million miles
- 2015: 1,734 million miles
- 2014: 1,731 million miles
Number of cycling trips (growth factor since 2010)
- 2010: 100.0%
- 2011: 105.1%
- 2012: 101.0%
- 2013: 100.2%
- 2014: 114.0%
- 2015: 116.2%
- 2016: 120.1%
- 2017: 120.8%
- No more recent data
12. Employment, 13. Innovation, and also, 14. Economic Structure
Area of new employment floor space and land (by type and location)
2020-21
- Offices: plus 2,100 square metres
- Industry & Warehouse: no change
2011-21
- Offices: plus 7,173 square metres
- Industry and Warehousing: plus 3.75 hectares
Employment and unemployment rate
People in employment (including self-employed)
- 2020/2021: 55,700 (75.3%)
- 2010/2011: 55,200 (75.0%)
Unemployment
- 2020/2021: 2,800 (4.8%)
- 2010/2011: 2,900 (5.9%)
Earnings (by type)
Gross Weekly Pay
- 2021: £661.00
- 2011: £597.80
Employment profile (by type)
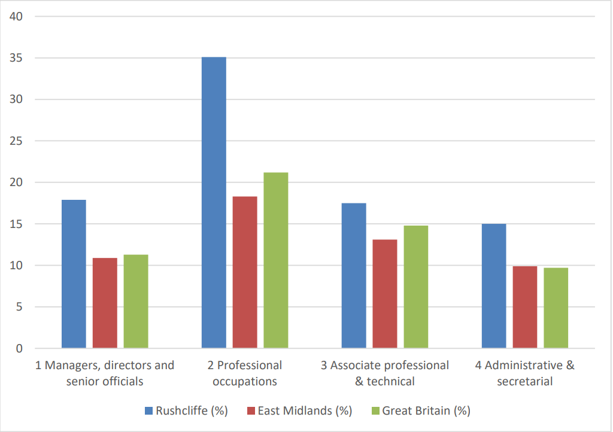
Employment by Occupation Latest data available. (Nomis not published 2020 and 2021 due to Covid)
- Managers, Directors and Senior Officials:
7.2% (2011), 18.3% (2019) (+11.1% over plan period) - Professional Occupations:
30.7% (2011), 29.6% (2019) (-1.1% over plan period) - Associate Professional & Technical:
15.4% (2011), 18.6% (2019) (+3.2% over plan period) - Admin & Secretarial:
16.1% (2011), 10.3% (2019) (-5.8% over plan period) - Skilled Trades Occupations:
8.3% (2011), # (2019) - Caring, Leisure & Other Service:
6.1%(2011), # (2019) - Sales and Customer Service:
7.6% (2011), # (2019) - Process Plant & Machine:
no data (2011), # (2019) - Elementary Occupation:
6.1% (2011), sample size too small (2019)
Qualifications (by equivalent level)
No Qualifications:
- 2011: 7.2%
- 2021: sample size too small
NVQ1 and above:
- 2011: 88.5%
- 2018: 89.8%
NVQ2 and above:
- 2011: 76.8%
- 2021: 82.0%
NVQ3 and above:
- 2011: 60.0%
- 2021: 67.4%
NVQ4 and above:
- 2011: 41.4%
- 2021: 50.0%
Type and area of employment land availability
2020/21
- 75.9 hectares B mx
Area of employment land lost to housing and other uses
2020/21
- 0 m
Accessible Documents
- Air Quality Action Plan 2021
- Annual Air Quality Reports
- Air Quality Strategy for Nottingham and Notts
- Annual Governance Statements
- Asset Management Strategy
- Become a Councillor 2022
- Budget and Financial Strategy
- Capital and Investment Strategy
- Climate Change Strategy 2021-2030
- Complaints Policy
- Compulsory Purchase Order Procedure Protocol
- Confidential Reporting Code
- Council Constitution
- Contaminated Land
- Corporate Enforcement Policy
- Corporate Strategy 2024-2027
- Council Tax Recovery and Enforcement Policy 2026
- Customer Access Strategy
- Design Code Baseline Appraisal
- Discretionary Housing Payments Policy 2024-2025
- Disabled Facilities Grant Policy
- Disclosure and Barring Service Policy
- Economic Growth Strategy 2024
- Empty Homes Strategy
- Environment Policy 2023
- Equalities Scheme 2021-25
- External Audit Completion Report 2024
- External Audit Completion Report 2023
- External and Internal Communications Strategy
- Freedom Of Information Policy
- HB Recovery and Enforcement Policy
- Homelessness and Rough Sleeping Strategy
- Housing Allocations Policy
- Housing Enforcement Policy
- ICT Strategy 2022 -25
- Information Management and Governance Strategy 2022-25
- Rushcliffe Borough Council Information Retention Schedule
- Internal Audit
- Leisure Strategy 2021-2027 review
- Local Code of Corporate Governance 2026/27
- Local Plan Part 1: Core Strategy
- Local Plan Part 2: Land and Planning Policies
- Local Plan Monitoring Report
- Local Scheme of Validation
- Off-street Car Parking Strategy
- Pay Policy Statement 2026/27
- People Strategy 2021-26
- Planning Enforcement Policy
- Play Strategy
- Procurement Strategy
- 2021-22 Public Inspection Notice
- RIPA Policy and Guidance
- Risk Management Strategy 2026-29
- Rushcliffe Nature Conservation Strategy
- Solar Farm Landscape Sensitivity and Capacity Study
- Statement of Gambling Licensing Principles
- Statement of Accounts
- Statement of Licensing Policy
- Street Trading Policy
- Supplementary Planning Documents
- Tenancy Strategy 2019
- Transformation Strategy and Efficiency Plan
- Tree Management and Protection Policy 2023
- WISE Agreement
- Conservation Areas
- Neighbourhood Plans
- The Nature of Rushcliffe 2021
- The Nature of Rushcliffe 2019
- Anti-Slavery Policy
- Modern Slavery & Human Trafficking Transparency Statement 2024-2025
- Annual Infrastructure Funding Statements
- Anti-Fraud & Corruption Policy 2025
- Communications and Engagement Strategy 2025-28
- Rushcliffe Design Code
- Technology, Digital and Customer Access Strategy
- Rushcliffe Nature Conservation Strategy
- Strategic Housing Land Availability Assessment Report 2024
- Biodiversity Duty Report January 2024 to December 2025
- Hackney Carriage and Private Hire Licensing Policy 2025 - 2030
- Playing Pitch Strategy 2025-28
- Collecting Unpaid Non Domestic Rates - Recovery and Enforcement Policy 2026
- Strategic Housing Land Availability Assessment Report 2025
- Transformation Strategy and Efficiency Plan